Chance auf mehrer 100% Gewinn??

einsatz + gewinn realisiert und hab noch anteile von einstiegszeitpunkt und die bleiben liegen, liegen ++++ copper macht mich froh ...
diese jahr geht noch einiges
katanga.png (verkleinert auf 45%)

% Shares Owned: 3.27%
# of Holders: 16
Total Shares Held: 62,334,399
3 Mo. Net Change: 11,887,414
# New Positions: 1
# Closed Positions: 3
# Increased Positions: 6
# Reduced Positions: 7
# Net Buyers: -1
By Daily Mail Reporter
Last updated at 12:34 PM on 5th May 2011
-

In the money: Ivan Glasenberg, chief executive of commodities giant Glencore will make £6 billion

Rich pickings: Katanga Mining in the Democratic Republic of Congo is one of Glencore's business interests
http://www.dailymail.co.uk/news/article-1383525/...are-15billion.html
Mr. Best will be based at the Company's mine complex in the Democratic Republic of Congo (the "DRC"). He has extensive experience in managing operations in the mining sector, particularly in base metals and in the DRC.
http://www.katangamining.com/kat/media/...leases/news2011/2011-05-06/
http://www.katangamining.com/kat/media/...leases/news2011/2011-05-09/
http://www.bloomberg.com/news/print/2011-05-09/...es-may-recover.html
http://www.cnbc.com/id/42968086
http://business.financialpost.com/2011/05/11/...falling-metal-prices/

Cobalt Mining & Cobalt Demand
Cobalt is an element that has many diverse and critical uses. In most applications, substitution for cobalt yields lower product performance. Below are cobalt’s most common usages.
2009 Global Cobalt Use(1) | % of Market |
Batteries - Cell phones, computers, hybrid vehicles, portable tools, etc. | 25 |
Chemicals - Includes pigments and dyes | 21 |
Super Alloys - Turbine blades, mainly jet engines | 20 |
Wear Resistant Alloys - Hard facing and cobalt carbide | 17 |
Catalysts - Includes Gas-to-Liquid conversions | 10 |
Magnets - High performance applications | 7 |
Cobalt in rechargeable batteries is the fastest growing use, while chemical (versus metallurgical) uses continue to surge as a percentage of the total. In 2009, the percentage of cobalt use for rechargeable batteries rose to 25% of total cobalt demand, its highest-ever level, and that percentage is forecast to rise to approximately 45% by 2018. Nickel metal hydride and lithium-ion batteries both contain cobalt and are used in hybrid electric vehicles (HEVs), computers, cell phones, portable tools, audio/visual units, and numerous electronic devices. The fastest growing segment of battery applications is for HEVs (and potentially EVs, or Electric-Only vehicles), which reduce air pollution and fuel consumption by at least 50% compared to conventional vehicles. The HEV “plug-in” option is even more environmentally friendly, and includes an extra cobalt-bearing battery that can be charged from electrical outlets and achieve fuel economies that exceed 100 miles per US gallon. In the US, roughly one-third of all CO2 emissions come from transportation sources.
The Toyota Prius HEV was named 2004 Motor Trend Car of the Year and 2005 European Car of the Year. The one millionth unit was sold in April 2008, and Toyota estimates sales of one million hybrid vehicles annually "as early as possible in the 2010s". In the next few years, the Company plans to offer all Toyota and Lexus models as hybrids. General Motors, Ford, Daimler-Chrysler, Mercedes, and others are attempting to catch up with Toyota’s hybrid success. Nearly all current HEVs use nickel-metal hydride batteries that contain about 22 pounds of nickel and 3 to 5 pounds of cobalt. Lithium-ion batteries containing 5 to 7 pounds of cobalt and little or no nickel are expected to dominate future HEV markets because they charge in minutes rather than hours and offer many other economic and technical advantages. Global production of HEV’s in 2007 was about 400,000-500,000 units, and is estimated to increase to 8 million units by 2015(2), thereby increasing annual cobalt demand by nearly 22,000 tonnes/year. In 2006, the world produced 69 million conventional cars and light trucks, and is expected to produce over 80 million units by 2015. According to JP Morgan Securities, the total number of electric cars will rise to nearly 13 million by 2020, representing a CAGR of more than 12% for the 2008-2020 period.
Cobalt Supply and Demand
The cobalt market is dynamic but small in comparison with other base metals. Consumers purchase cobalt through negotiated agreements, bids, and open markets from producers, traders and to a lesser degree, government stockpiles and private inventories. Approximately 48% of the world’s 2007 cobalt mined was a byproduct of nickel from sulfide and laterite deposits. An additional 37% was produced as a byproduct of copper operations, mainly in the Democratic Republic of the Congo (DRC) and Zambia. The remaining 15% of cobalt mining came from primary producers.
Several new projects are deemed to be sufficiently advanced and financed to produce significant quantities of cobalt in 2010-11 (mainly as a byproduct), including those listed below. However, until that time cobalt demand may exceed production due to limited new production and the absence of stockpiles. Additional projects may also come on stream in the intermediate term, however political and logistical issues in the DRC may endanger the viability of some of the larger projects. Approximately one-third of known global cobalt reserves are in the DRC, and close to 40%-50% of incremental production over the next five years is anticipated to emante from the DRC (assuming the projects are completed as planned), essentially all as by-product from copper projects.
Major New Projects | Start Up Year |
| Annual Prod. |
| Tenke Fungurume | 2009 | DRC | 4,000 |
Talvivaara | 2009 | Finland | 1,000 |
Katanga | 2010 | DRC | 4,000 |
Kamoto | 2010 | DRC | 1,000 |
Weda Bay | 2010 | Indonesia | 1,000 |
Goro | 2010 | New Caledon. | 1,500 |
Ambatovy | 2011 | Madagascar | 3,500 |
Formation Metals | 2011 | USA | 1,000 |
Ravensthorpe | 2012 | Australia | 1,000 |
KOV | 2012 | DRC | 1,000 |
Ramu | 2013 | PNG | 1,000 |
Nama | 2013 | Zambia | 2,000 |
Mukondo | 2013 | DRC | 1,000 |
Boleo | 2013 | Mexico | 1,000 |
Total | n/a |
| 22,000 |
Cobalt consumption in 1995 was only 24,000 tonnes, but grew to 60,100 tonnes in 2008, for a compound annual growth rate (CAGR) of 7.4% for the 13-year period. In 2009, world demand declined modestly to 59,900 tonnes due to the impact of the global economic crisis in 2008-09. On the supply side, 2009 cobalt production rose modestly to 59,700 tonnes, up 5% compared to 2008.
In the chart below, actual world supply and demand data from external sources are used through 2009, whereas the demand projections from 2010 through 2018 are based on a 9% CAGR (principally due to the "catch-up effect" following the aforementioned demand decline in 2008-09). The combination of production from existing mines and new production is expected to yield a 7.5% CAGR between 2010 and 2018, which would result in potentially significant supply deficits in the 2016-18 period.
World Cobalt Supply
 |
Source: Actual supply and demand by USGS, The CDI, and other independent research groups. Projections after 2009 were developed by Geovic. |
Roskill Consulting, an international group that researches mineral industry information, estimates 2011 demand in a most likely case to be 72,500 tonnes(3), 5% above the forecast from Geovic mining. This forecast accounts for the potentially dramatic growth in batteries for hybrid vehicles and new demand from emerging markets such as China and India.
Refined Cobalt Production in 2009 & Reserves(4).
Country | Mine Production | Tonnes x 1000 | Tonnes x 1000 |
Australia | 6,300 | 1,500 | 1,800 |
Brazil | 1,000 | 29 | 40 |
Canada | 5,000 | 120 | 350 |
China | 6,200 | 72 | 470 |
DRC | 25,000 | 3,400 | 4,700 |
Cuba | 3,500 | 500 | 1,800 |
Morocco | 1,600 | 20 | n/a |
New Caledonia | 1,300 | 230 | 860 |
Russia | 6,200 | 250 | 350 |
United States | 0 | 33 | 860 |
Zambia | 2,500 | 270 | 680 |
Other | 3,200 | 180 | 1,100 |
Total | 62,000 | 6,600 | 13,000 |
*includes reserves plus measured and indicated resources |
There are no published statistics on world use of cobalt scrap, but the USGS estimates 2006 U.S. scrap consumption was about 25% of reported US consumption.
Prices
Cobalt prices fluctuate significantly in response to world events and changes in the overall supply/demand balance. Historically, cobalt prices have had limited transparancy, although quotes can be found from sources such as Platt's Metals Bulletin and www.minormetals.com. On February 22, 2010, the London Metals Exchange (LME) plans to launch the first-ever cobalt futures contract, which should materially improve such transparancy.
As of October 2010, the 3-year and 20-year average prices of 99.8% cathode cobalt are approximately $26.50/lb. and $18/lb, respectively.
Footnotes
Much of the project and cobalt market data in this report were obtained from the four sources below:
(1)The Cobalt Development Institute, www.thecdi.com.
(2) Credit Suisse Metals & Mining report, 04-02, Avicenne 2009
(3) The Economics of Cobalt, 11th Ed., 2007 by Roskill Information Services Ltd., www.roskill.co.uk
(4) USGS website, http://minerals.usgs.gov/minerals/pubs/ commodity/cobalt/.
References
Cobalt market data, publications and related services may also be obtained from other
sources, including:
- SFP Research - www.sfp-metals.co.uk
- The CRU Group - www.crugroup.com, or www.crustrategies.com
- GFMS Metals Consulting Ltd., www.gfms-metalsconsulting.com
- World Bureau of Metal Statistics, www.world-bureau.com
- Mineweb - Manganese: The Unsung
Macquarie Commodities Compendium
17 May 2011
Cobalt:
No stopping the supply surge
In a market as heavily oversupplied as cobalt, it is difficult to find anything to get overly enthused about. While the market is not as out of kilter as suggested by the CDI statistics for2010 (>10kt in a 70kt market), the balance is not favourable. After an early year push supported by rampant industrial output, the cobalt prices have remained stubbornly below the US$20/lb mark for high grade material. However, after selling off well before other metals on the back of a potential decline in Japanese demand post-disaster, early May has seenrenewed buying interest. Meanwhile, after falling through the February-March period, LME stocks have almost doubled since this point, and the spectre of oversupply will continue toweigh on the market throughout our forecast period.
As ever, Chinese trade is key to sentiment in the cobalt market. With plenty of potential supply available, there should be fewer impediments to, or competition for sourcing cobalt seen in other commodities where China is the marginal buyer. However, while not falling, Chinese imports of cobalt concentrate and intermediate products has been reasonably static, even in a rising demand environment. This suggests there is plenty of material available onthe ground in China, acting as a buffer to upward price movements. That said, with concentrate prices having remained relatively robust as metal prices have fallen, the margin squeeze on Chinese processors should mitigate significant downside risk.
The problem of supply-demand imbalance in cobalt has never come from weak demand potential. Indeed, cobalt is strongly exposed to sectors with rapid growth planned in the coming years. We see aircraft engine demand rising at 14% CAGR in the 2011-2016 period,while the combination of ageing and heavier populations should see prosthetic demand for cobalt grow at 12% CAGR. Cobalt also has exposure to the machinery cycle through high strength steel demand while the rechargeable battery sector has always promised much withfor cobalt demand –we still see this area adding the most growth in absolute terms.
With demand so strong, much of cobalt's difficulties come from the fact that, unlike manyother commodities, the supply side is performing. Part of this can be attributed to the fact that 40% comes from by-product operations, however other key parts of the market have beengrowing at or above expectation. Refined metal output in Africa has rebounded strongly afterthe financial crisis, with output now equivalent to over 10,000tpa, from under 5,000tpa in H12009. Meanwhile, H2 2010 metal production performed better than the chemicals side, however still-strong Chinese IP numbers seems to have redressed this in 2011. With the fully-traded LME cobalt contract now one year old, it does appear to be gaining increasing acceptance in the marketplace. Volumes have been increasing through Q2, while open interest positions have remained reasonably unchanged.
http://www.scribd.com/doc/55676517/5/No-stopping-the-supply-surge
Macquarie Commodities Compendium
17 May 2011
Copper
The market is tightening up and deficit will bite in 2H11, 2012
From current spot prices, our most bullish call in base metals is copper, notwithstanding ourshort term copper sell call we put in place on March 7th and re-iterated on April 12th this year.After a period of scrap and consumer de-stocking and weak Chinese semi‟s output (highprices and tight credit), the fundamentals in the copper market are starting to turn and we seethis continuing for the remainder of 2011 and into 2012.In particular, May has seen scrap discounts narrow, TCs fall, SHFE stocks falling sharply,LME stocks start to decline, Chinese physical premiums rise, the Chinese forward curvemove into backwardation, the Chinese import arbitrage go from negative to slightly positive,and semi‟s output show signs of improving in China. Ex-China continues to recover, withconsumption less than 10% below the level it was in 2007/1H08 before the financial crisis.We expect that a 350-400,000t deficit in 2011 will see total global copper inventories in termsof weeks of consumption fall to low levels (similar to those seen in the last boom period), andwe continue to forecast a 200,000t deficit in 2012. While our base case is that very strongmine supply growth on a two-three year view will move the market into small surplus in2013/14, inventories are not expected to rise much above critically low levels (about threeweeks of consumption) and as such, prices are forecast to remain >US$3/lb over the period.
Our bullish 3-18 month copper view rests on three pillars:Chinese copper semi‟s output will „normalise‟.By semi‟s normalising, we mean,semi‟s output recovering from the relatively low levels seen in Jan/Feb/Mar 2011, to alevel which gives 7% YoY growth for full year 2011. On this basis Chineseconsumption of copper units (refined and scrap) should rise by around 10% fromMarch levels through the remainder of 2011 (normally consumption is strongest inMay/June but this may be delayed in 2011 owing to a temporary squeeze on semi-fabricators owing to tight credit and high prices).That global consumer de-stocking will slow /end, with upside from potential re-stock. Consumer stocks are very difficult to get data on. However, we do havesignificant anecdotal information to suggest that Chinese consumers have de-stockedfrom 10-14 days of stocks in mid 2009 to 2-3 days in 2H10 (voluntary de-stockingowing to higher prices), and practically nothing recently (hand to mouth stock levelsowing to involuntary de-stocking following the tightening in credit conditions in 1Q11).Outside of China ,various anecdotes point to consumers consolidating their supplychains and reducing stocks, firstly in late 2008/09 (in line with lower demand) and thende-stocking further over the past six months (owing to higher prices and tight credit).On the one hand this consumer de-stocking has resulted in rising visible stocks (stockshifting, exaggerating theapparent global surplus in recent months), and on the otherthis de-stocking has reduced refined demand. As global de-stocking is largely thoughtto have finished, consumer consumption of refined copper should rise significantlyover the coming months. To the extent Chinese consumers are underutilised owing totight credit; they could raise output and restock at the same time over the coming sixmonths, which would be particularly bullish.
The bull market is on, with 2011 and 2012 likely to be the peak years.
That global scrap de-stocking will slow / end.
The increase in scrap availabilityevidenced by a sharp widening in scrap discounts globally which began in Sept/Oct2010 and evidenced by the increased use of scrap by Chinese smelters and refinersthrough 2H10 is reportedly nearing an end. At the CESCO conference, we spoke withscrap market participants and heard that scrap de-stocking was well advanced inEurope, and to a lesser extent scrap de-stocking had taken place in the US. In linewith this we have seen a significant narrowing of scrap discounts across the globe(particularly in China), as per Figure 11.In addition there are medium term supply risks such as unexpected weather issues (anotherLa Nina in 2012 for example affected Chilean output from the SIC grid) or political issues(which could affect DRC output or Humala potentially winning the Peruvian election in June and nationalisation impacting future Peruvian copper supply growth). So far in 2011 we haveused up over half of our 720,000t disruption allowance, and we are less than half way throughthe year.Although we cannot be certain, we continue to think it is more likely than not that theBlackrock (US$1bn) and JP Morgan (US$0.5bn) physically backed copper ETFs will be approved and will absorb at least the initial 150,000t of copper. In Fig 9, we show the impacton global stocks in terms of weeks of consumption if 150,000t of copper is “taken” from themarket as at end-2011 and 200,000t as at end-2012.
http://www.scribd.com/doc/55676517/5/No-stopping-the-supply-surge
http://af.reuters.com/article/idAFLDE74J0QI20110520
http://af.reuters.com/article/metalsNews/idAFLDE74M0SS20110523
Author: Reuters
Posted: Monday , 23 May 2011
http://www.mineweb.com/mineweb/view/mineweb/en/...=Detail&pid=504
http://af.reuters.com/article/metalsNews/idAFLDE74O0GQ20110525
May 27, 2011, 0:52 IST
Copper, a leading indicator of global equity market direction, is flirting with the Chinese wall of support — the 200-day moving average. The average is regarded as the wall of China by long-term investors, a breach of which indicates switch in market bias.
The wall of China analogy seems very appropriate. It is well known the rise in copper prices was due to strong demand and hoarding in China. As China began tightening its monetary policy, demand began to ease in the country, leading to a steady fall in prices. The decline since February 2011 has now taken copper prices to its 200-day moving average, which essentially is the Chinese wall of support for the metal.
When prices are above the 200-day average and retreat down to it, the average acts as support. On the other hand, if prices are below the average and prices rise up to it, the average acts are resistance.
Prices often bounce from support and fall from resistance.
Over the last two weeks the price of copper has moved above and below the 200-day moving average. This indicates the bulls and bears are fighting each other to prevent the market from moving against them. A close below the 200-day average gives a bearish bias to copper and if prices are unable to stay below the average the signal is that the bulls are winning.
For a confirmation of the bearish bias the moving average line should be sloping down and prices should be below it. Right now prices are moving above and below the average, but the average is sloping up. This means the bearish bias has not been confirmed. We believe copper must close below $3.60 on Chicago Mercantile Exchange traded copper futures contract (Symbol @HG). At the time of writing this article copper was trading at $3.97. One contract controls 25,000 pounds.
IMPORTANCE OF COPPER
Copper is a leading indicator of what the stock market will do. In late December 2008, copper bottomed and began to consolidate, by moving sideways. The markets continued down, but copper was giving a signal that the equity markets would turn soon. In early March 2009, copper broke out of consolidation range and began a rally. It was then that the stock market bottomed and began to follow copper up.
There is a fundamental reason for the importance of copper’s price action. The metal is used in several manufacturing processes and an increase in the demand for copper indicates the economy is gathering steam. There is lag between the purchase of copper by a manufacturer to completion of the product, its sale and revenue realisation. Increased revenue realisation by companies result in a rise in the equity prices. Hence, we see copper prices leading the equity markets.
Right now bears in the equity and copper market should tread cautiously. If the 200-day moving average acts as support and copper rallies, the sell-off in the equity markets is likely to end soon. On the other hand if copper continues on its way down, it’s likely that the equity markets will follow. Watch out for the copper futures contract to close below $3.60 for continuation of the bearish trend.
http://www.business-standard.com/india/news/...se-wallsupport/436889/
Ich möchte nur erinnern an die Aussage des MM, wonach ja bis Juni d. J. die Produktion auf 150.000 t Cu/p.a. hochgefahren werden soll. Letztes Jahr lag man soeben bei 35.000 t und dazu Kobalt. Der Aussage nach müßten die 35.000 t (nebst Kobalt) des letzten Jahres ja bereits im Q 2 dieses Jahres weit überschritten sein. Somit Steigerung um das 4-fache und dann noch der hohe Cu-Preis.
Mag sich jeder selber überlegen, ob der Rücksetzer nochmals eine gute Gelegenheit ist.
Ich habe für mich folgende Rechnung aufgemacht:
150.000 t/p.a.!
x 9.000 §/t - (geschätzt) 1.000 $/t Kosten
wären op. 1.2 Mrd. Gewinn.
x (üblich) 4,5 ergibt 5.4 Mrd. Firmenwert, demnach bei 2 Mrd. shares
2.7 $/share. Könnte mit entsprechender Vorwegnahme bis Ende d. J./Anf. nächsten Jahres erreicht sein. Aber wie das MM ausführt, sollen in einem weiteren Schritt 250.000 t/p.a. erzielt werden. Kobalt und der übrige "Beifang" ist in meiner Berechnung noc außen vor.
Bislang habe die Branche nur schwerfällig auf den Rekordpreis beim Kupfer reagiert, erklärte einem Bloomberg-Bericht zufolge das chilenische Center for Copper & Mining Studies in einem aktuellen Bericht. Als Grund für die zögerliche Reaktion führen die Experten sinkende Erzgehalte, immer tiefer reichende Minen und höhere Kosten an.
Der weltweite Kupfermarkt sehe sich im laufenden Jahr einem Angebotsdefizit von 377.000 Tonnen an, hieß es von der International Copper Study Group, da die Nachfrage, angeführt vor allem von China und anderen aufstrebenden Volkswirtschaften, das Angebot deutlich übertreffe..."
Quelle: http://www.goldinvest.de/index.php/kupferproduzenten-muessen…
-------------------------------------
Das Problem hat Katanga mit seinen Erzgehalten nun wahrlich nicht. Deren Timing ist einfach perfekt. Sie produzieren und verkaufen, produzieren und verkaufen...
:o))
Ff Geld 1,20 €
Toronto SK 1,74 1,2 % ist pari 1,2445 €.
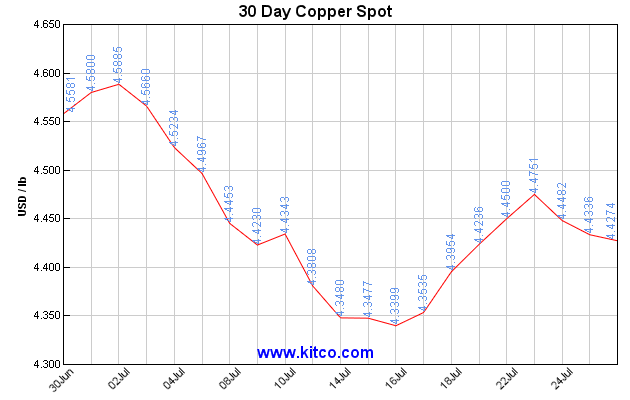
Und die Q 2 Zahlen rücken immer näher. Bis Ende Juni will nach eigener Aussage das MM die Jahresproduktion auf 150.000 t Cu hochgefahren haben.
Cu Preis: fest über 9.000 $/t (9.253 + 0,41 %)
http://tools.boerse-go.de/rohstoffe/
http://seekingalpha.com/article/...es-look-set-to-continue-their-rise
http://www.nasdaq.com/earnings/...amp;symbol=SNRCF&selected=KATFF